A read for people who track their power output down to the watt, but maybe haven’t looked too hard at the crash statistics. Not the most fun of topics, that’s for sure. However, perhaps by knowing what is causing the biggest issues for cyclists (in Europe), perhaps we can also take that into account and try to stay as safe as possible.
The European Transport Safety Council just published their PIN Flash 50 report in April 2026, and it is dense, it is thorough, and it is, honestly, a bit sobering. I spent a weekend with it so you don’t have to spend as much time with it, though I’d encourage you to perhaps have a scan through it, as it is very detailed, country-specific, and a sobering read.
Watt I Learned
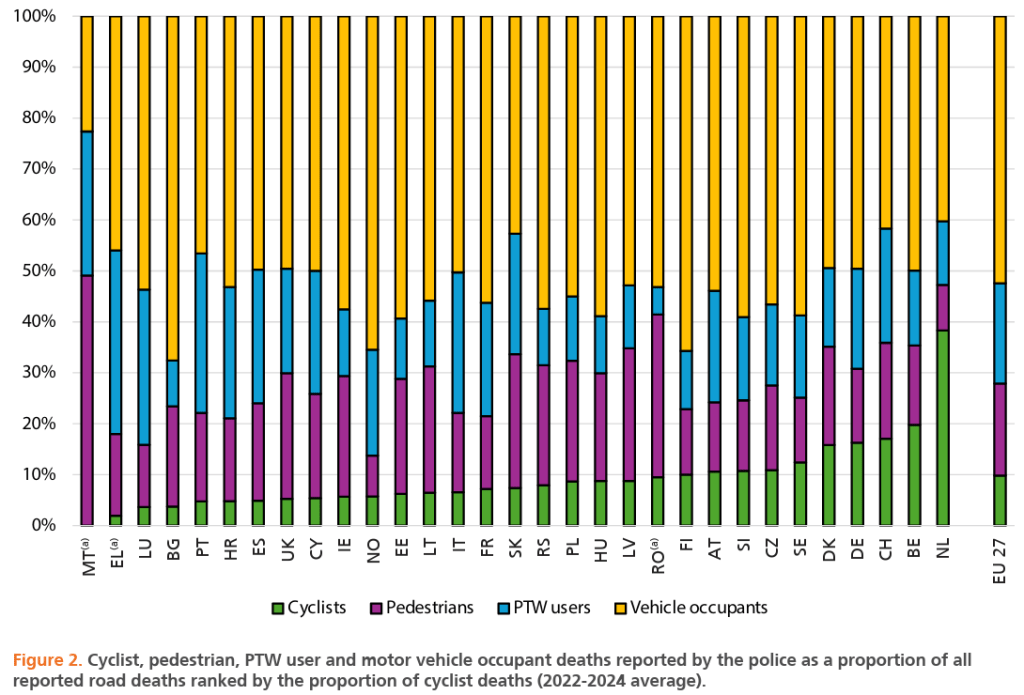
Cyclist deaths across the EU dropped by just 8% over the last decade, from 2014 to 2024. That sounds like progress until you see that pedestrian deaths dropped by 31% and car occupant deaths dropped by 19% in the same period. Two-wheeled motor vehicle users barely moved (up 2%). Cyclists are, by a significant margin, the road user group making the least safety progress!
In 2024, 1,926 cyclists were killed on EU roads. That’s one number. The other number: 33,803 were seriously injured, and reading through the report it is stated that this is almost certainly a massive undercount. Studies across multiple countries consistently find that only around 10% of injured cyclists actually end up in police statistics. The rest fall through the cracks. For example, in Switzerland, police recorded roughly 3,600 injured cyclists in 2020. The actual estimated number was 33,600.
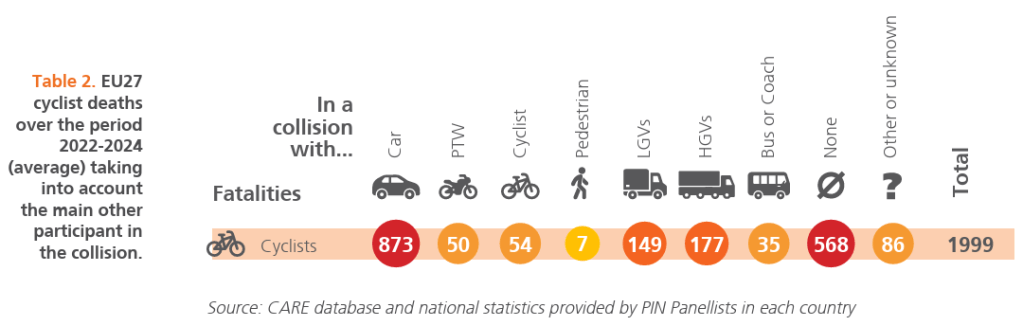
Sixty-five percent of cyclist deaths in the EU result from collisions with motor vehicles. Passenger cars alone account for 44% of all cyclist deaths. Heavy goods vehicles, trucks, account for 9%, and vans another 7%.
Think about that in the context of your typical training ride. You’re probably going out at some point on a road with cars. Probably also some delivery vans. If you’ve done any riding in Belgium, Netherlands, France, or Germany, you know what HGV traffic feels like when it passes you at speed on a rural road (nightmare-ish!). The data says that’s where a lot of the fatalities are happening, so avoid these areas as much as possible. Also, speaking from personal experience a little bit, any heavy industry zones, where there is a lot of loading of massive trucks, often around canals, can be nice to explore in the weekend but extra dangerous during the weekdays due to the truck traffic in those areas.
A bit of a weird one then is that twenty-eight percent of cyclist deaths, happen in what is refered to as “single-bicycle crashes”. Meaning that no other vehicle is involved. Falls, infrastructure failures, road surface issues, maybe a moment of inattention at speed, those things. This is the number that surprised me most. If you’re training for a hilly gran fondo and you’re bombing descents in a group, that 28% is relevant to you in a way that has nothing to do with cars.
Less surprising then to any runner or cyclist reading this, will be that e-bikes are… an issue. In every single country that separates e-bike data from conventional bicycle data, Austria, Germany, Switzerland, Netherlands, Belgium, France, Denmark, Italy, deaths among e-bike users are going up. Meanwhile, deaths among conventional bike users are going down in almost all of those countries (France and Germany are exceptions).
In the Netherlands, head injuries among e-bike riders rose by 86% between 2020 and 2024. For kids aged 12-17 on e-bikes, the increase in head injuries was 522%. Five hundred and twenty-two percent.
More e-bikes on the roads means different traffic dynamics, they’re faster than most people expect, ridden by people with varying experience levels (I’m being nice here..), and their behavior in group riding situations or at intersections isn’t always predictable.
They also analysed the ages of the cyclists involed. Fifty-one percent of all cyclists killed in the EU are 65 or older. That’s more than half, from an age group that makes up 21% of the EU population. Cyclist mortality for the 65-79 age group is 9.5 deaths per million population. For over-80s it’s 13.9. In the Netherlands, where more people cycle more km per day than anywhere else in Europe, it’s 35 per million for 65-79 year olds and 89 per million for those over 80.
For those of us in the 30-49 range building toward a first Ironman or a major sportive, we sit at 2.4 deaths per million population, meaningfully lower, but not zero. The 50-64 group hits 5.4 per million, more than double. This isn’t meant to be alarming, it’s just context: the risk profile genuinely changes as we age. Our reaction times shift. Our bone density changes. What we could bounce back from at 35 we maybe can’t at 58.
The other thing the age data tells us is that the e-bike risk is particularly concentrated in older riders, because older riders disproportionately use e-bikes. Higher speeds, longer distances, greater physical vulnerability, sometimes medication that affects balance or reaction time.
The report breaks down collision types by country, and there are some genuinely striking differences. In Sweden and Finland, over half of cyclist deaths are single-bicycle crashes, no cars involved. In Latvia, Croatia, Poland, and Lithuania, collisions with cars account for 60-66% of cyclist deaths. In Estonia, heavy goods vehicle collisions account for 36%, the highest in Europe.
If you’re doing training camps or events in Eastern Europe, the car collision risk profile is higher than in Scandinavia. If you’re riding in the Nordics, the solo infrastructure crash risk is relatively higher. And if you’re anywhere that sees heavy freight traffic on roads that also see cyclists, you should probably be a lot more deliberate about timing.
Fifty-six percent of cyclist deaths happen in urban areas. Which is worth remembering when you’re doing a training ride that starts and ends in the city, the first and last few km are, statistically, where more of the danger is concentrated.
A sobering read, and a reminder to us to stay safe out there. And, wear a helmet. If you care to dig through the report and the many, many details, the report is public and free, the full dataset is at etsc.eu/pinflash50.


Leave a comment